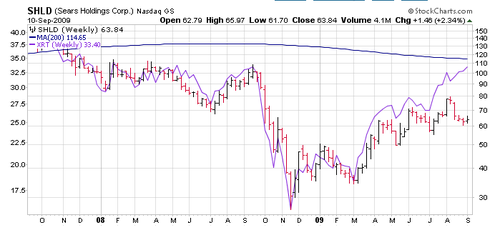
I have distributed an article from Barrons on Sears Holdings. We study accounting to interpret what is likely to happen in financial markets. That is the use of fundamental analysis. Technical analysis consists of using charts to analyze future price movements. Here the purple line is the Exchange Traded Fund for Retail, XRT. I overlaid it with SHLD to see how Sears stacks up with the retail area in general. As you can see, retail stocks overall, shown in purple, have continued to climb. SHLD however has hit resistance at 70-80 and backed off. THe markets are telling us they do not believe SHLD is as good a bet as the rest of retail.
This is what the Barrons article predicted, now can you analyze the cash flow statement to see why this is true, again, this is why we study accounting.

Leave a comment