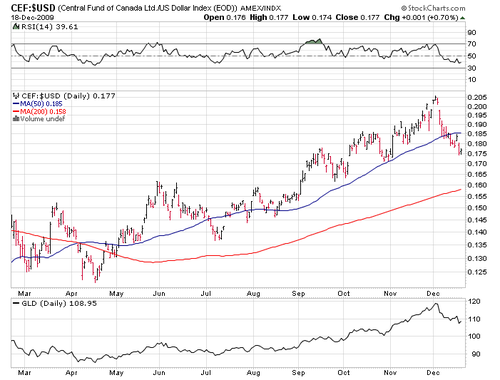
This
is a ratio chart of Central Fund versus the US Dollar. CEF has outperformed the
dollar, until Dec 1. Note the ratio went below the 200 bar moving average to
really kick this off in April. The message is that we expect the 200 bar MA to
be tested and overthrown again.
Well
tell you what let’s look at the bond market before we go…

This
is the very long picture of the fall in rates since the top in 1981. Rates have
followed the 50 bar MA all the way down. We assume that the spike to two
something percent on the thirty year and zero on t bills is the bottom of rates.
Note 39 year rates are now 4.45%. The 200 bar MA is at 5.5%. So a mere 100
basis points would turn up a thirty year trend.
At
top the rate of change from last fall’s panic low has topped out, significant
on a thirty year chart, okay, twenty nine years and counting…
Our
point here is that the bond market bears watching for what is ble to be important events in 2009. How
important is the bond market? Glad
you asked.
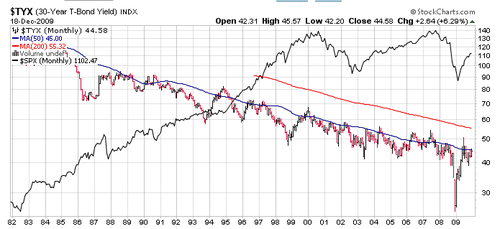
Bond
yields are in black and red. They topped at 14% shown on the right scale in
1981 The stock market, the solid black line bottomed at that point. Money moved
from CDs, safety, to the stock market, risk. And that continued until 2000.
The stock market managed to come
all the way back up to 1500, but has not done so since. Low interest rates move
money to stocks, high interest rates discourage stock investing, why bother
when 14% is available at the
insured local bank (now a much larger question mark than in 1981!). Note the stock market has NOT come near
its previous high despite trillions of dollars poured into the ecomomy by Time’s
Man of the Year.
Monitoring
the bond yields should be the final clue to stock market behavior in 2010.

Leave a comment