Is there a universal magic bullet for stock market timing? The use of a 13 and 34 week exponential moving average may be as close as it gets.

The 13 week crossed the 34 week in late 207. Note that it never crossed the 34 week again until after the crash low! Clearly the use of moving averages will lag a big turn in the market until the MAs catch up with the new trend. But, had one gone short and covered at the buy point,
one would have made a lot of money
one would have sat out the entire crash.
The distance between the two MAs is beginning to widen which is a worrisome alert. Note the two MAs were the furthest apart at the March low. ANd the MACD is nearing the zero line on the histogram. And the black red MACD is getting very very close together. Let''s watch this closely.
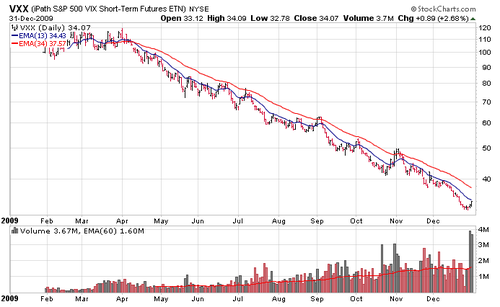
NO Fear! The VXX is an index that is composed shows put buying, ie, insurance against a decline in teh market. There is no fear at present. But the volume has increased the last three months, and particularly the last few days of 2009. But until we get a MA crossover, complacency reigns.

Leave a comment