Tuesday Jan 12 2009
Many analysts are now tracking the VXX. Note, the VXX is a
reverse bullish indicator, low VXX readings mean an optimistic stock market.
High VXX readings mean maximum put buying and pessimism. Let’s take a look at its early warning
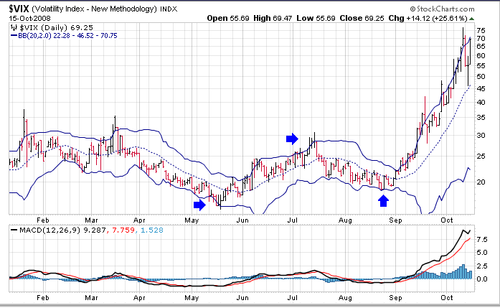
signs to see if it can help two years in a row. Last year the VXX dropped below the Bollinger band, two
standard deviations in May, This is the extreme low and a sign that the market
has reached some sort of maximum optimism as the VXX is an indication of put
buying. It quickly reversed in a week, doing the opposite in just two months
registering a throwover in July. It pulled back and made a higher low in late August but not a throw under as in
May. After that, the successful re test of the lower band, it was off to the
worst crash in decades.
Looking back, then as now, the VXX made a pretty good low in
late February but it proved to be another early warning shot…
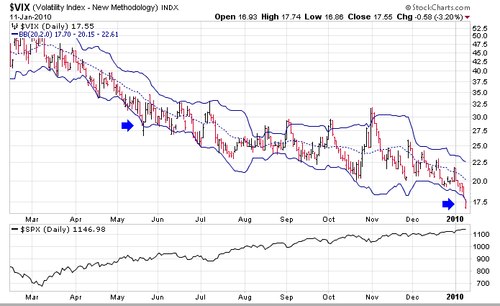
The VXX throwunder registered a false signal in May, (hm
like Feb 2008) well the VXX did then rally but it was not the end of the stock
market rally. Note we put the SPX at the bottom. There are ample reasons to be
looking for a top now however. The markets have completed the same 52% or so re
tracement they completed in 1930. Bullishness is high and some 450 stocks are
above their 50 day moving averages. If the same scenario plays out we are
single digit months away from a significant market turn.

Leave a comment