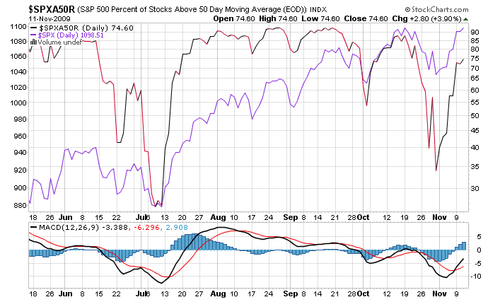
The purple line is the SPX stock index. At the July low, the breadth shown by the % of stocks above their 50 day MA bottomed at the same time as the actual index. Then the breadth dramatically expanded, lots of stocks moving up in the black line, which pulled up the overall index. In Oct the opposite thing happened The breadth dropped to 35%, but the overall index stayed up, no doubt due to institutions buying the heavier weighted stocks in the index. A lack of overall participation in the market, fewer and fewer stocks up, is a sign of distribution and potential topping action.

Leave a comment